
Data distributions – How is my data distributed?
Why care about data distribution?
Most statistical tests are based on assumptions regarding data distributions. Hence, when we do statistics, we always have to think about how our data is distributed.
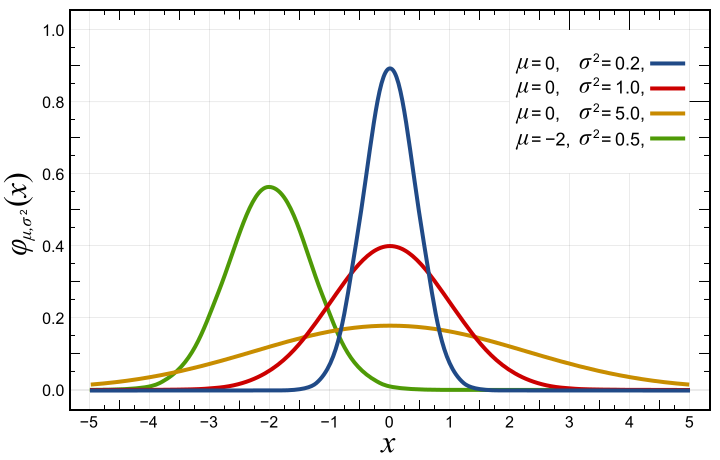
Normal data distributions

A large part of statistics is based on the normal distribution, because it’s so easy to work with it. The normal distribution occurs, when many small influences, which are not related to each other, affect the outcome of an experiment. A typical example is the so called “Galton board”. In this experiment, the path of the balls depends on the pegs inserted here on the top of the board. If enough balls and pegs are used, we will obtain a bell-shaped distribution, similar to a normal distribution. But of course, a normal distribution is continuous and there are no vertical separations as in this board.
Typical real-world examples of normal distributions are body weight or height, which are in fact influenced by many independent factors or genes. Hence, weight and height are approximately normally distributed.
Non-normal data distributions
Although, the normal distribution is convenient to work with, in nature data are often not normally distributed. As the author Aidan Lyon (2014) states:
Strictly speaking, there are no quantities in nature that are distributed normally—or at least, there are very few. However, there are many quantities in nature with frequency distributions that are very well approximated by normal distributions.
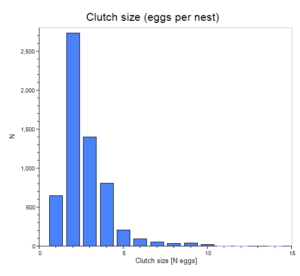
An example for non-normally distributed data is the number of children per houshold. Most households have two children, followed by one child and no child. Households with three, four or more children were much rarer. This data is hence clearly not normally distributed. Also clutch size, i.e. the number of eggs per nest, is typically non-normally distributed (see example with clutch sizes from from Jetz et al., 2008, on the left), as a low number of eggs is more frequent than a high number of eggs. While low egg numbers are most frequent, very high number may occasionally still occur. As a result such a distribution is not symmetric.
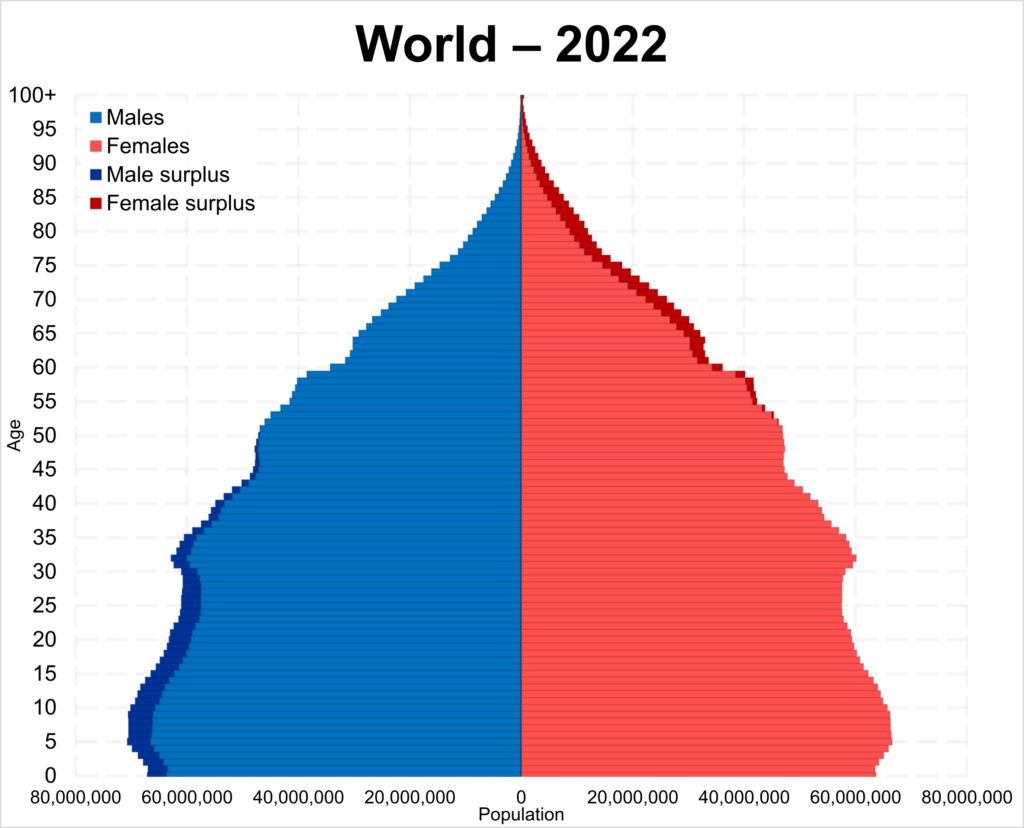
Also age is not normally distributed. On the left we see the age distribution of the world in 2022. Also these data are clearly not normally distributed, since younger people are much more frequent than older people.
Another example of non-normally distributed data is lifetime reproductive success (see this publication for an example), i.e. the number of offspring produced by an animal in it’s entire life. In most species, the majority of animals don’t even reach the reproductive age and hence have no offpspring at all. Most animals reaching reproduction, breed only a few times. Only very few anials usually produce a large number of offspring. For this reason, reproductive success if often exponentially distributed.
How can I determine how my data is distributed?
There are different ways how to understand how you data is distributed. First, you can think about your data, and second, you can conduct a statistical distribution test. Often, thinking about your data can already give you a good idea of how your data might be distributed. You can ask yourself the following questions:
- Are there any limits for your data?
- For example, a family can only have no child, one child or more children. There can never be a negative number of children. Hence your data is probably not normally distributed, because a normal distribution extends from minus infinite to plus infinite. Another example of limits are percentages: A percentage, at least if it represents occurence, can only extend from 0% to 100%. Or – if you use frequencies – , from 0 to 1. Such data can only be described by a beta distribution.
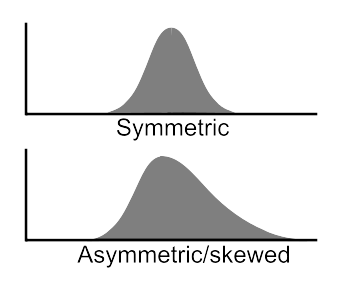
- Is your data skewed?
- If you know that data distribution is not symmetric but skewed to one side, then you already know that data is not normally distributed. Such data is usually best described using a skewed distribution. Examples for skewed distributions are:
- Gamma distribution
- Weibull distribution
- Lognormal distribution
- If you know that data distribution is not symmetric but skewed to one side, then you already know that data is not normally distributed. Such data is usually best described using a skewed distribution. Examples for skewed distributions are:
- What is your data type?
- Sometimes the type of data may already indicate how data will be distributed. Counts usually follow a Poisson distribution, which may look similar to a normal distribution only when you have many counts. But for small numbers, such a distribution is skewed to the right.
Statistical tests
Another possibilty to learn more about the distribution of your data are statistical tests:
- If you want to test if your data follows a normal distribution, the best choice is Shapiro-Wilks test. This test has been developed specifically for normal distributions and it is very sensitive. However, make sure you have a large enough sample, e.g. at least about 30 values.
- If you want to test if your data follows different distributions than the normal distribution use Kolmogorov-Smirnov test. This test is only slightly less sensitive than Shapiro-Wilks test, but it can be used for any kind of distribution.
References
- Lyon, A. 2014. Why are Normal Distributions Normal?. The British Journal for the Philosophy of Science 65: 621-649.
- Jetz, W., Sekercioglu, C.H. and Böhning-Gaese, K. 2008. The worldwide variation in avian clutch size across species and space. PLoS Biology 6: e303.


