
GSS – Guided Statistics for Scientists – List of features
Guided Statistics for Scientists is a powerful tool for statistical analyses. GSS does not only include a very comprehensive set of methods and tests for statistical analyses, but it is also designed to make statistics easy and straight forward to use, even for beginners, who may not have a background in statistics yet. For example at each step during an analysis help and in-depth information is offered and it is clearly pointed out which statistical analysis is suitable for a specific task and data type.
Therefore, even if you are new to statistics and just want to apply statistical methods for your paper or thesis, GSS is a perfect companion guiding you to the right method or test. This is facilitated also by an intuitive user interface. Our aim is that after conducting an analysis, you know exactly what you did, why you did it and what the result means. See also the feature matrix to understand the differences of the different GSS versions.
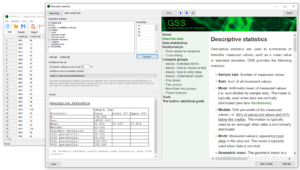
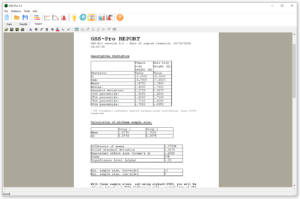
Descriptive statistics
Descriptive statistics are used to summarize or describe measured values. GSS provides a range of descriptive statistics, such as mean, median, mode, geometric mean, standard deviation, variance, standard error and many more.
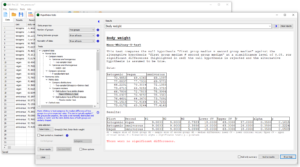
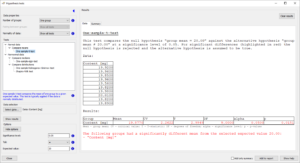
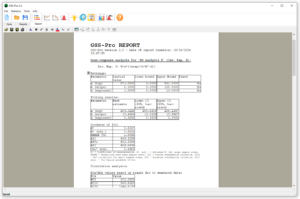
Statistical hypothesis testing
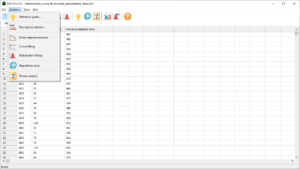
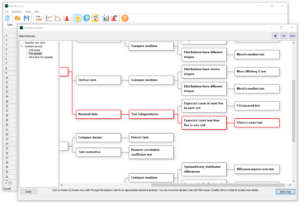
GSS includes a powerful module for statistical testing, which was designed to make test selection an intuitive process. In addition, it is very comprehensive, includes all standard tests and also many tests that are not often found in other statistical software. For an easy start into statistical hypothesis testing, GSS supports various ways to enter data. Hence there is no need for previous data processing or formatting. The intuitive user interface then provides step by step guidance through the data analyses, allowing even those with less experience to easily find the right statistical tests for the given datatype and purpose. For any remaining uncertainties a built-in statistical guide and comprehensive help is available. In short, GSS helps anyone to understand the statistical background of the tests available and on how to interpret results.
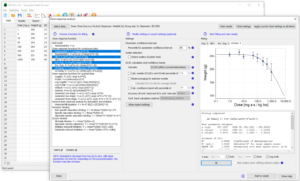
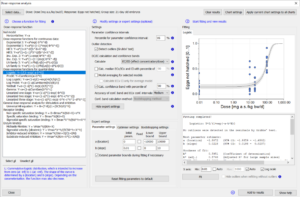
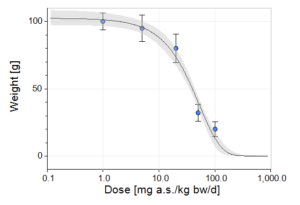
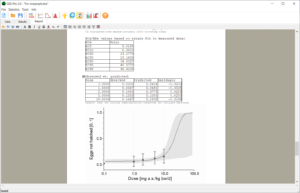
Dose-response analyses
All versions of GSS include a very powerful module for dose response analysis. GSS offers a variety of mathematical functions which can be fitted to the measured data to find the best possible description of the dose response relationship. Various goodness-of-fit measures are therefore available to justify the selection of a fitted function. In addition, confidence limits and confidence bands are provided to assess the uncertainty of an estimated parameter and of the uncertainty of the dose-response relationship.
Distribution fitting and curve fitting
Distribution fitting is an essential part of many statistical analyses, because without knowing how your data is distributed it may be difficult to find an adequate statistical test for your data. In case you are in doubt about the distribution of the data, you can use the distribution fitting tool implemented in GSS.
Also, a curve fitting tool is included in GSS, which helps you to describe relationships or to assess correlations. In order to determine which function best describes your data, GSS calculates various goodness of fit measures. In addition, several correlations tests can be conducted, including Pearson, Spearman, Kendall’s (tau-b and tau-c) or Somer’s measure of association.
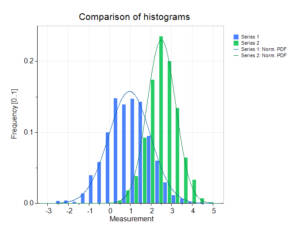
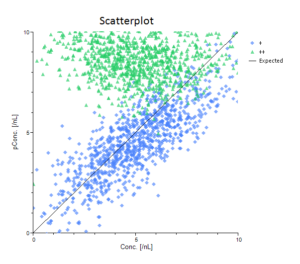
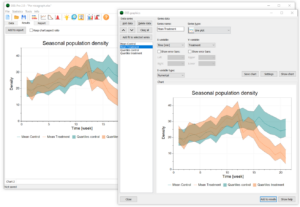
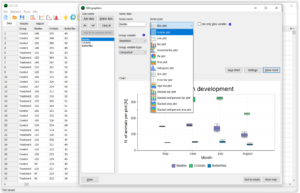
Powerful scientific charts
For the visualisation of your data GSS includes a powerful chart building tool, designed to produce clean graphs suitable for scientific publications. Furthermore, there are many options to customise graphs and to save your favourite chart designs for future use. The chart designer also includes a functionality for adding curve fits to your charts.
Reporting
While conducting statistical analyses you can add all your results (or just the ones you need) to a report. A report is a text document, which can include results, tables and graphs of your statistical analyses. You can modify a report freely or you can add additional explanations as needed. This report can be the basis for your next publication.
List of features
Descriptive Statistics
- Sample size
- Sum
- Mean
- Median
- Mode
- Geometric mean
- Harmonic mean
- Standard deviation
- Variance
- Standard error
- Percentiles
- Confidence intervals
Dose-response analysis
- Null model
- Standard functions for continuous data (Horizontal line, Exponential 3, Exponential 5, Hill 3, Hill 5, Inv. Exp. 3, Inv. Exp. 5, LN family 3, LN family 5)
- Standard functions for quantal data (Logistic, Probit, Log Logistic, Log Probit, Weibull, gamma, Linearized one stage, Linearized two stages, Linearized three stage)
- General dose-response analysis for stimulation and inhibition (Universal Hill equation)
- Receptor binding (Non-specific saturation binding, Specific saturation binding, Sigmoidal specific saturation binding)
- Enzyme kinetics (Michaelis-Menten, Sigmoidal velocity, Inhibitor-induced inhibition, Substrate-induced inhibition)
- Various goodness-of-fit-measures (R², adjusted R², NRSME, AIC, AICc, BIC, Chi²)
- ECx and ICx calculation
- Outlier test (Grubb’ test)
- Options for automatic data transformation
- Wilson scores for quantal data
Curve fitting
- Standard functions
- Dynamic growth functions
- Periodic functions
- Kinetic functions
Distribution fitting
- Probability density/mass function (Binominal, Poisson, Geometric, Uniform, Normal, Log-normal, Exponential, Gamma, Weibull, Beta, Logistic, Extreme)
- Cumulative distribution function (Binominal, Poisson, Geometric, Uniform, Normal, Log-normal, Exponential, Gamma, Weibull, Beta, Logistic, Extreme)
Hypothesis tests
- Hypothesis tests for one group
- One-sample-t-test
- One-sample-sign-test
- One-sample Kolmogorov-Smirnov test
- Shapiro-Wilk test
- Hypothesis tests for two groups
- Two-sample-t-test (incl. Minimum detectable difference, MDD)
- Paired t-test
- F-test/Bartlett-test
- Welch-test
- Mann-Whitney-U-test (incl. Minimum detectable difference, MDD)
- Wilcoxon-signed-rank-test
- Two-sample Kolmogorov-Smirnov test
- Mood’s median-test
- Paired sign-test
- McNemar-test
- Chi-squared-test
- Fisher’s exact test
- Hypothesis tests for more than two groups
- ANOVA
- Repeated measures ANOVA
- Bartlett-test
- Jonckheere’s trend test
- Kruskal-Wallis-test
- Mood’s median-test
- Levene-test
- Brown-Forsythe-test
- Mauchly-test
- Friedman-test
- Quade-test
- Cochran’s Q-test
- CPCAT
- Correlations
- Pearson correlation coefficient test
- Spearman’s rank correlation coefficient
- Kendal rank correlation coefficient (tau-b) test
- Kendal rank correlation coefficient (tau-c) test
- Power analysis for t-test
Charts
- Scatter plot
- Line plot
- Bar plot
- Horizontal bar plot
- Pie plot
- Area plot
- Histogram plot
- Box plot
- Error bar plot
- High-low plot
- Stacked bar plot
- Stacked percent bar plot
- Stacked area plot
- Stacked percent area plot
More tools
- Random deviates/numbers (Monte Carlo)