Derived vs original data?
Derived data
When presenting the findings of a study people often do not show the original data that were measured. Instead they create so called ‘derived data’. Derived data can be:
- Percentages
- Rates
- Ratios
- Indices
- Etc.
For example, considering a data set on smoking behaviour, percentages could be used to describe the proportion of smokers in a sample. These data are nominal data, since the attribute smoking was measured:
| N: | 10 |
| Smokers (incidence): | 2 |
| Percent: | 20% |
Here the original data is the number of smokers (2 smokers) and the sample size (N=10). The percentage is derived data. While using derived variables, such as a percentage, may be an intuitive way to present results, it should be noted that when only showing percentages or other derived data, there is a loss of information. If we only see percentages, then we don’t know how reliable the data is. This is because 20% could either mean 1 out of 5 individuals was a smoker or it could mean that 1000 out of a sample of 5000 individuals were smokers. This would be a much more reliable sample. Hence when showing derived data, it is always good to present at least the sample size.
Another issue with derived data is that data type changes! For example, using percentages means that we have transformed non-metric data (no. of smokers/non-smokers) into metric data. Now we don’t have counts of attributes anymore, but we have metric data (e.g. 20.0% or 72.4%). This also means, that we have to choose different statistical tests, because those for non-metric data are not suitable any more.
Original data
So what is the best way to use and present data? For presenting data using derived variables is fine. For statistical testing, however, original data should always be preferred. If you use derived data, then (because of the loss of information) there is a chance that we don’t detect differences, which we would have detected if we had used original data.
A completely transparent presentation of a statistical analysis, showing also derived data, could be:
In a small sample of patients (10 women, 10 men) there were more smokers in men (30%) than in women (20%). However, this difference was statistically not significant (Fisher’s exact test: p = 1.000).
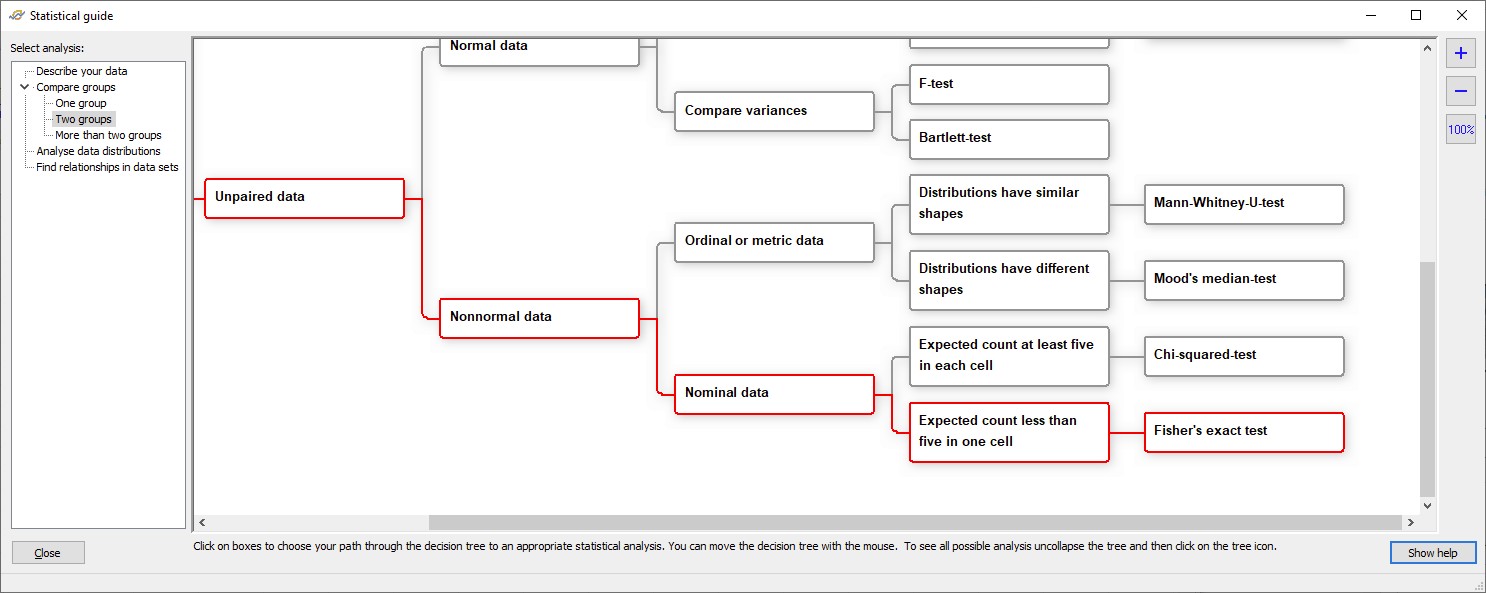
Then you have all the information needed to understand how meaningful the difference is. Why do we use Fishers’ exact test? If we look into the flowchart for test selection (see screenshot from the GSS software below), we have two groups (woman and men), data is not paired (pairing means that you have e.g. observations form the same patients before and after treatment; this is not the case here), we have no information on data distribution, hence we choose nonnormal data to be on the safe side. Data type is nominal data (smoker/non-smoker, these data are not metric and there is no ranking order in the groups) and finally we have counts smaller than 5, hence Fishers’ test is the appropriate choice.
Further drawbacks of derived data
Finally, there are further drawbacks when using derived data:
- Loss of accuracy: Using derived data does not only mean a loss of information (information on the sample size), but also a loss of accuracy: a value of e.g. 1.2 may be any value between 1.15 to 1.25.
- Change of distribution type: Derived variables are often not normally distributed, even if original data are normally distributed. This can easily be seen when considering percentages: Percentages can only range from 0% to 100% (or from 0 to 1). Such data cannot be described with a normal distribution, which goes from –infinite to +infinite. Also a lognormal distribution would not be suitable, since it extends from >0 to +infinite. The only distribution which can describe percentages is a beta distribution which is limited to values between 0 and 1 (or 0% and 100%). However, you will have difficulties finding a tests designed to work with a beta distribution. The only option may be to use a test for which no assumptions regarding data distribution is made.
Conclusions
Derived data are useful for presenting data, since e.g. a percentage provides an easy to understand summary of the data. However, for statistical analysis it is preferable to use original data.