
How to compare two groups?
When doing statistics analyses, one of the most frequently asked questions will be “is there a difference between two groups?”
The two-sample t-test
The two-sample t-test is a powerful tool in statistics, that has been developed just for this purpose, i.e. to compare the means of two groups.
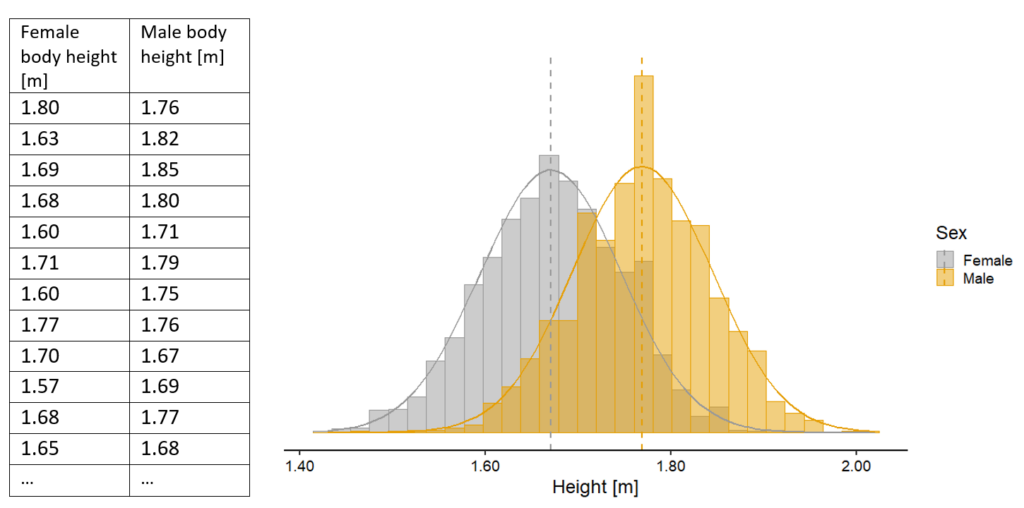
Imagine you’re a researcher interested in studying the heights of people in your city. You collect data on the heights of both male and female residents to see if there’s a difference between the two groups (women and man). By comparing the shapes and positions of the two height distributions, you could already visually assess whether there are any noticeable differences in height between women and men. This visual comparison provides an initial insight into the potential differences between the two groups before even formally conducting a statistical test.
Now, you want to know if there’s a statistically significant difference in average height between these two groups.
Requirements for t-test
Whenever you use a statistical test you have to check whether there are any requirements for the test or if it is suitable for your data. In this example, we already knew that we wanted to perform a two-sample t-test, because this is the subject of this article. But let’s still see why can we use a two-sample t-test for our data:
To use a t-test our data needs to fulfil the following assumptions:
- The data is continuous
- The data is normally distributed
- The standard deviations of the groups are approximately equal (this is called “homogeneity of variances”)
All these assumptions are met with our data. The data is continuous (to learn more about data types, click here). From the histograms we can see that our data approximately follows the bell-shaped curve of a normal distribution (to learn more about normal distributions, click here; for a proper statistical analysis we would conduct a statistical test to confirm this, i.e. Shapiro-Wilks test) and we can also see that the variances of our two groups are homogenous, meaning that the variability of our two groups is similar (for a proper statistical analysis we would also conduct a statistical test to confirm this, i.e. Bartlett’s test). We also know that we want to compare the means of two groups, hence the two-sample-t-test is our test of choice.
If you want to learn more about how to select the right test for your data, also check out our article about test selection.
The two-sample t-test in GSS
To perform a t-test in the software GSS, you have different possibilities to enter your data, therefore, there is no need in formatting your data beforehand. In this case, we have two groups and each group is in a separate column. We then use Statistics > Hypothesis tests and simply chose two-sample-t-test. You specify your data and let GSS calculate the results by pressing on “Show results” to calculate this test.
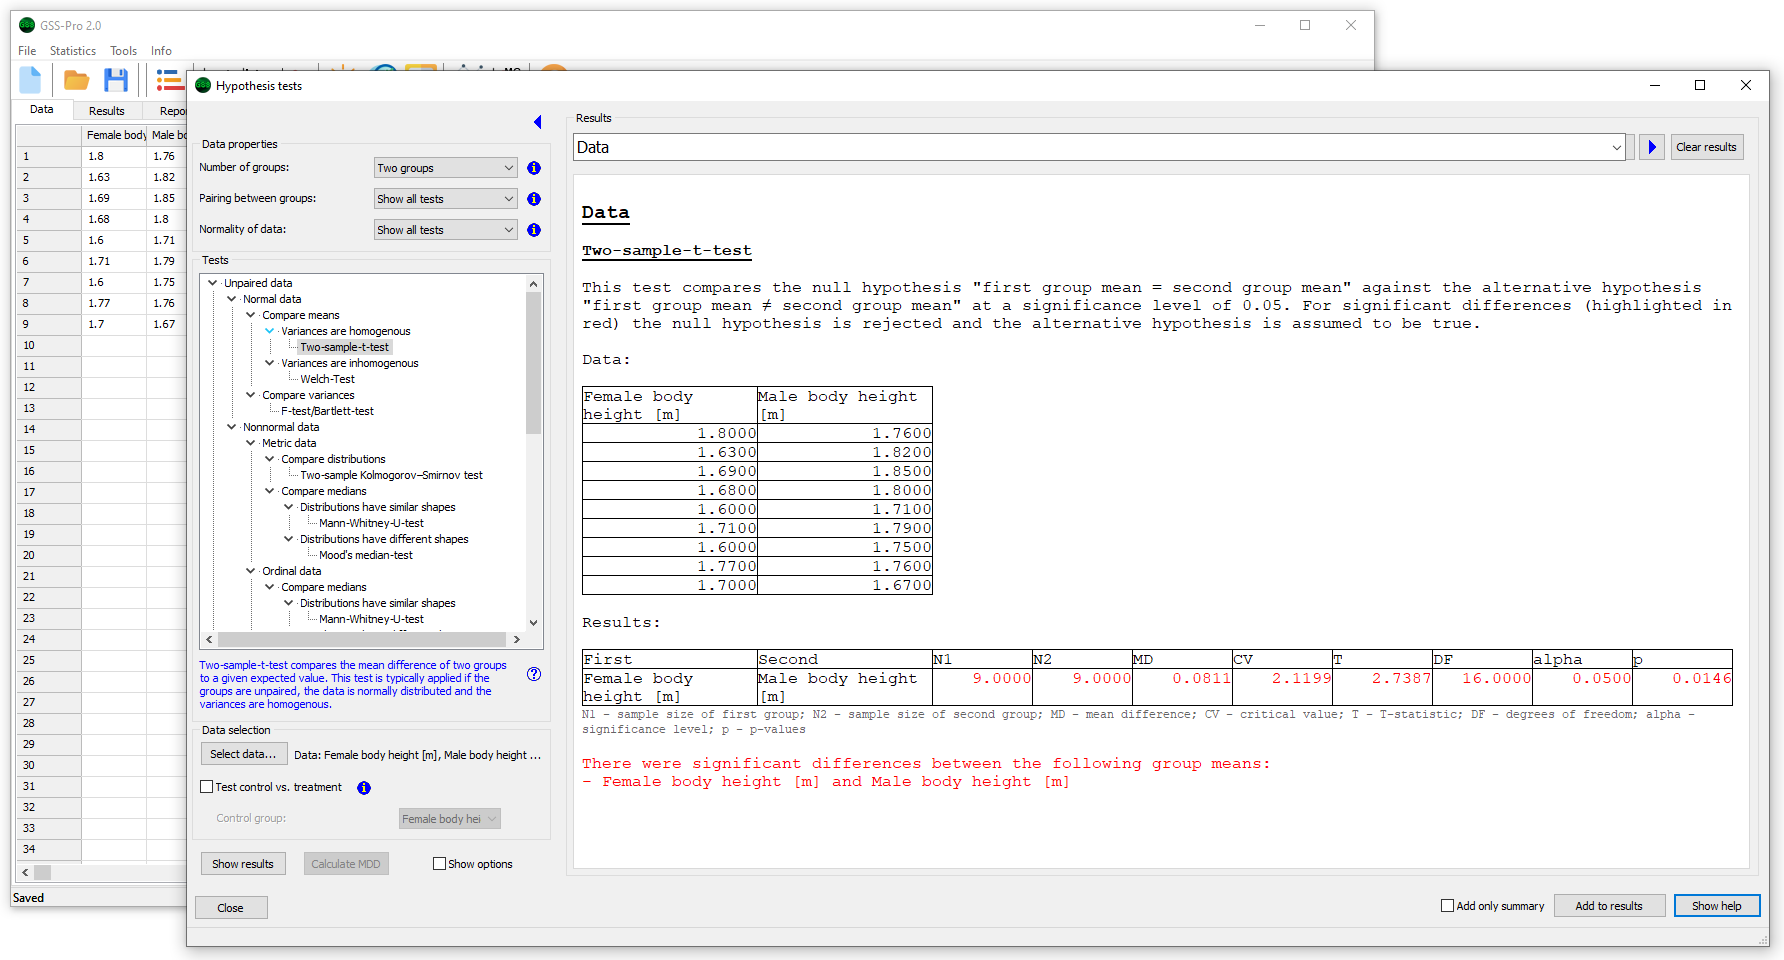
The p-value
In the screenshot above you can see the results of our two-sample-t-test. The most important measure we will get is the p-value. If the p-value is small, typically less than 0.05, we can conclude that the difference of our mean values is statistically significant. Hence here we have a significant difference, and so we reject the “default” assumption that there is no difference between the groups (the assumption that there is no difference is called ‘null hypothesis’.
Hence the gender very likely has an effect on height in our example.


